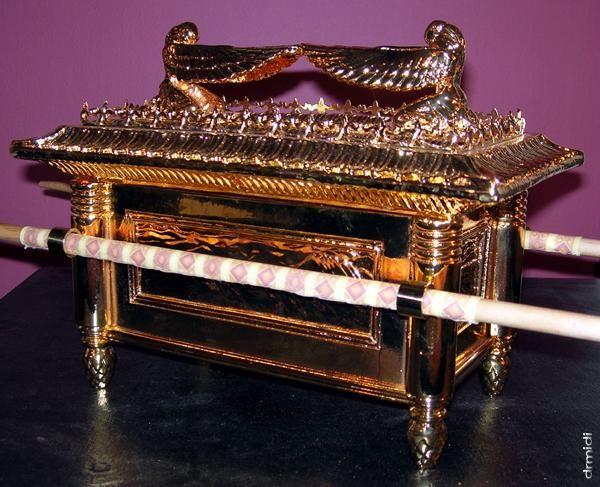
 APL of the Covenant … A Transmitter for talking to Plasma TV Gods. My little play on words from the movie “Raiders of the Lost Ark.” Calibrating with APL patterns on plasma TVs. This article will quantify the differences that people should expect when they decide to use “Average Picture Level” or “Average Pixel Level” or “APL” for short test patterns on their plasma TVs rather than the traditional windowbox patterns.
The attempt here is to somehow bypass/eliminate/compensate for the effects of the ABL (Auto Brightness Limiter) that is a part of every plasma TV ever built. (It’s like trying to quantify GOD … or at the very least, squishing all the food you eat in one day down to a soup to determine the calorie count of things. What if you just liked the taste of something that day?)
The problem here is that if you don’t understand what is happening and why, any rationalizing just ends up as being similar to a bunch of monkeys in a room coming to a consensus on how a TV works , but since none of them actually had any understanding in the first place, their conclusions still have no validity, consensus or not.
I will just be taking a series of readings from 10% to 100% with a whole bunch of test patterns both normal ones and then APL ones and let’s see where the chips fall. The set up in this lab test is with a 50″ Samsung plasma PN50B860 (Newest Samsung Plasma found here) and a Video Forge generator and a C6 / X-Rite i1 Display Pro
type probe. All the measurements are simply relative to each other and not any indication of being absolutely correct. The display is actually calibrated correctly with my Jeti Spectro device.
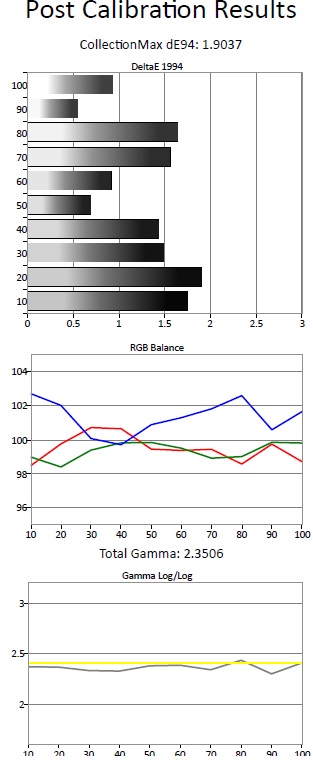
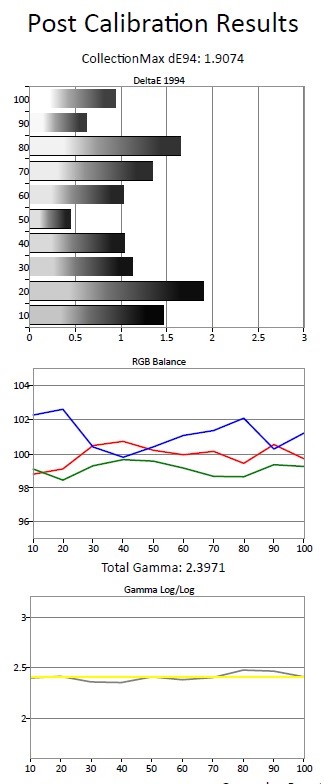
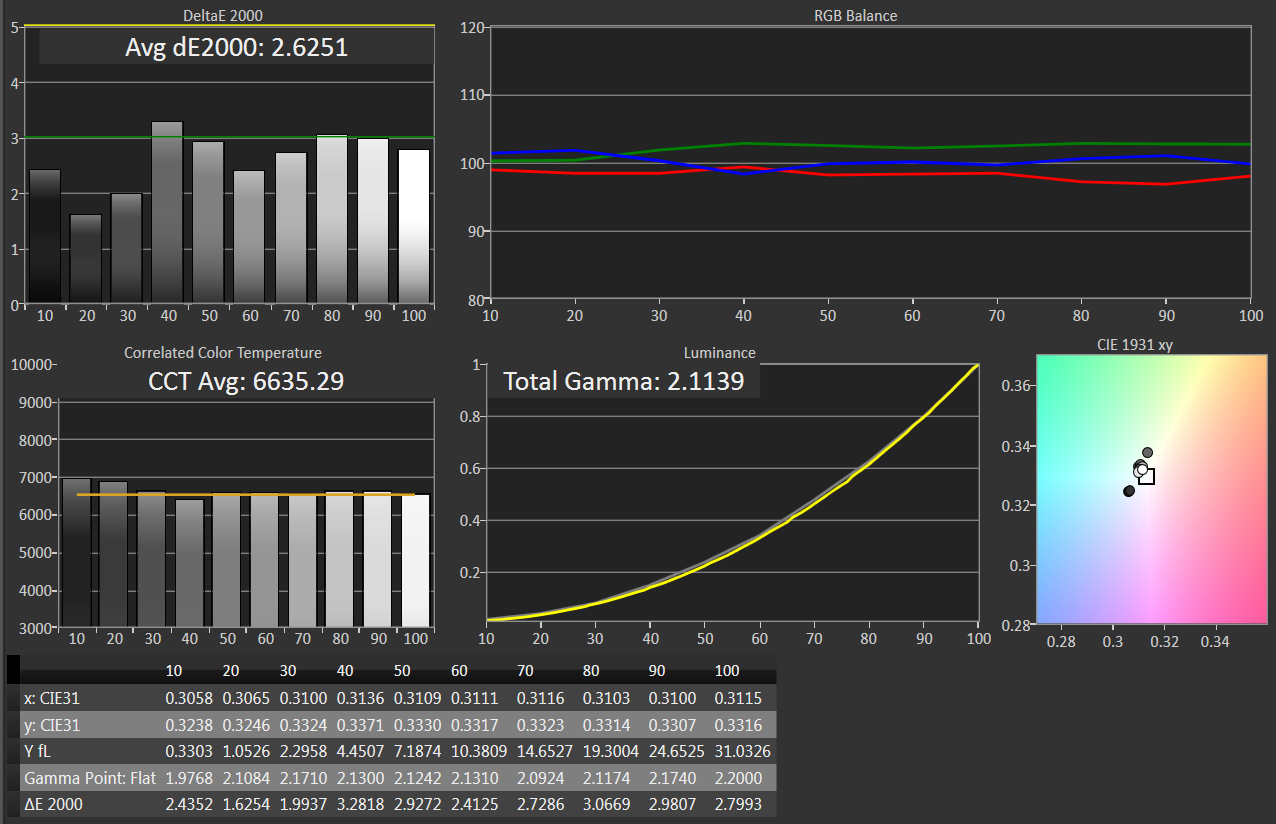
So first up are some images of the calibration based on the standard 18% windowbox. Everything that comes after it is relative to the original calibration based on those patterns. Note the worst dE number is below 2.0 with any dE less than 3 considered to be beyond human perception. I will only raise an eyebrow if that error goes above 3.0 as anything less here is the proverbial wheel spinning. “Because we can, not because it actually results in an improved image that we can see with our eyes.” Gamma is in the 2.36 range.
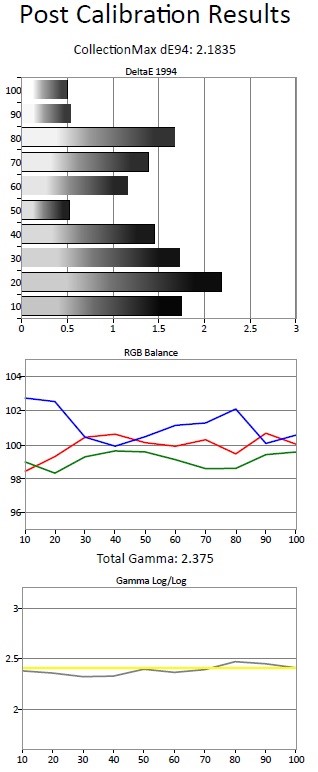
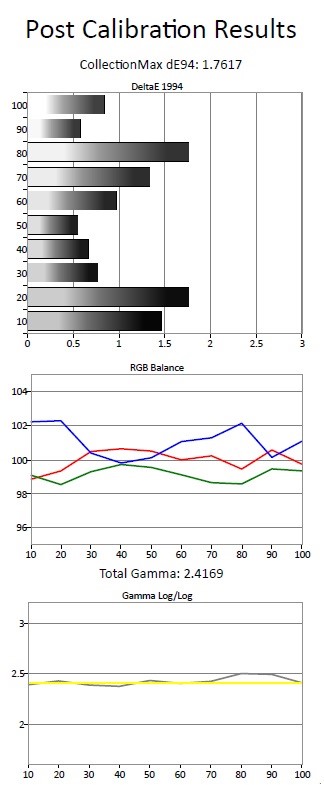
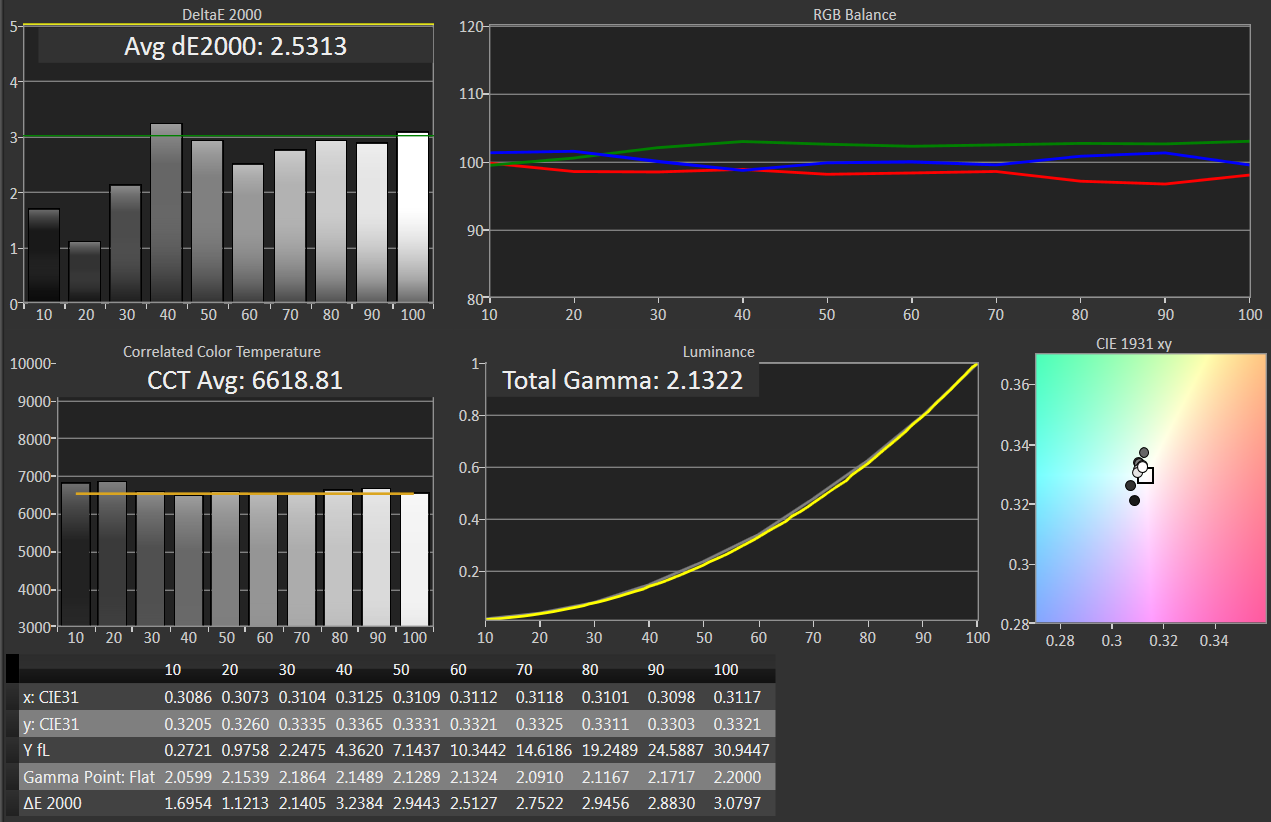
Next up are the readings based on a standard 10% windowbox. Get used to what you are seeing. Worst dE is 2.0.

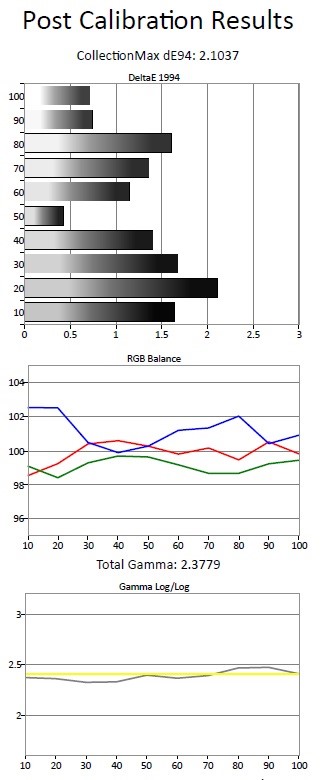
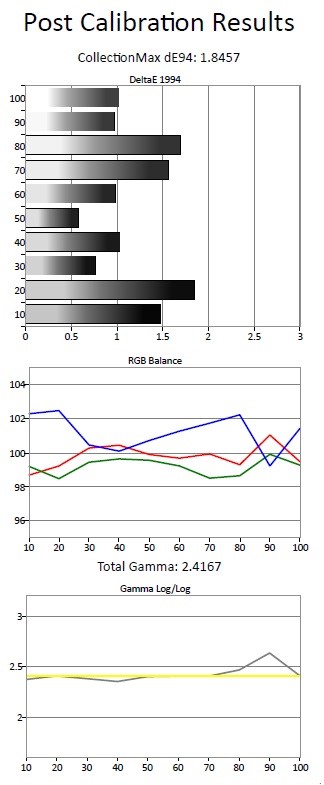
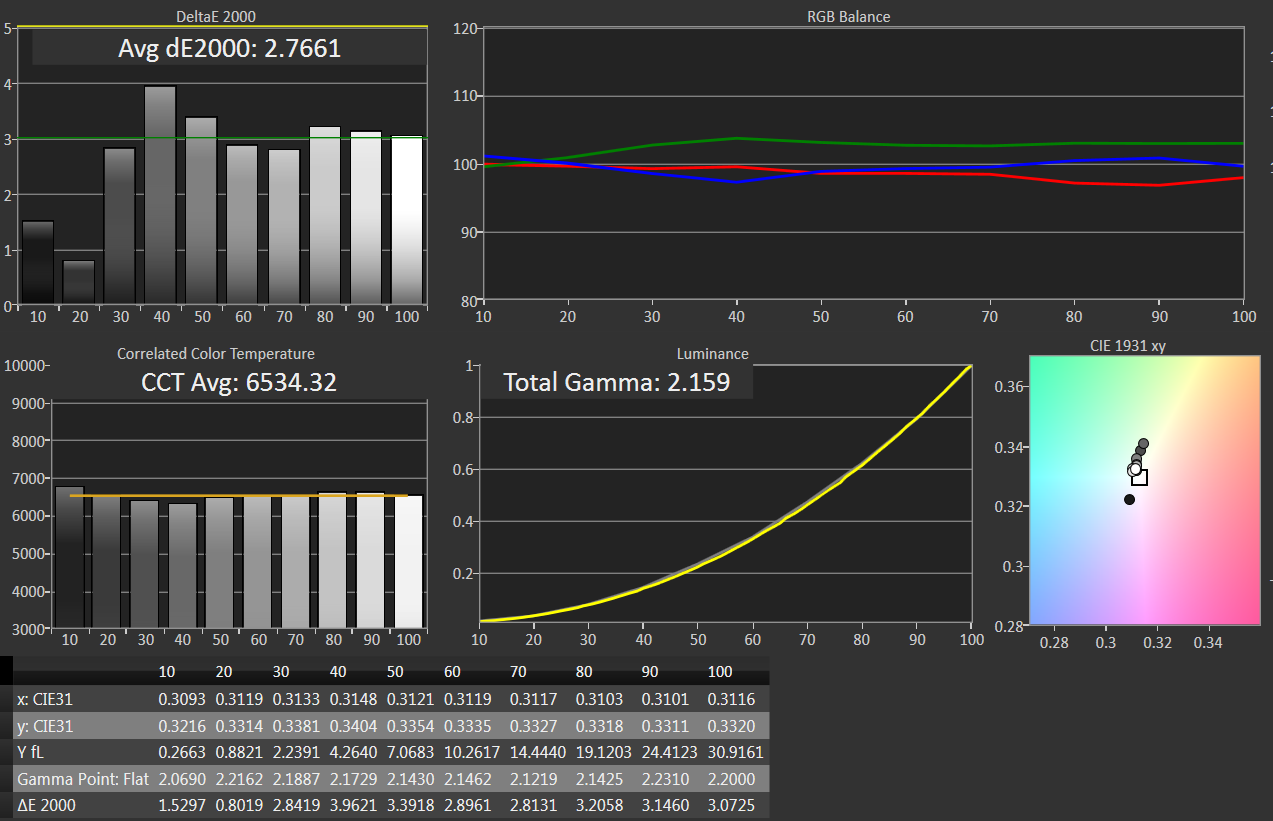
Next up are the readings based on a standard 5% windowbox.
Now things get interesting as I start to use APL test patterns. The first one has a 10% background surrounding a 10% windowbox pattern.
Next up are the readings based on an 18% APL and a 10% windowbox. Are we seeing a pattern here yet?
Next up are the results from the 25% APL readings on the 10% Windowbox.
Last up are the readings from a 50% APL on a 10% windowbox pattern.
I didn’t really know what to expect although I had guessed that it probably would not have made that much of a difference. And it made even less of a difference than I thought it would be. Some of the difference might be just random changes that also occur if you just keep taking the same reading over and over again. My biggest surprise actually came with the gamma numbers because my Samsung plasma here behaved very differently than what I found on Panasonic plasma sets. It didn’t really matter much about what size of windowbox I chose as the gamma just remained consistent. On the Panasonic plasma sets, the larger the windowbox pattern the lower the actual gamma number would go. An 18% windowbox would give an average gamma of 2.05 to 2.10 … and a 10% box would up the number to the 2.15 to 2.18 range.
And now data from a Panasonic 54VT25 plasma set (Newest Panasonic Plasma ST60 found here) that I asked Ray Coronado at SoCalHT for. He also has the C6 and the Video Forge to gather this data quickly for me. Here is the Panasonic stuff.
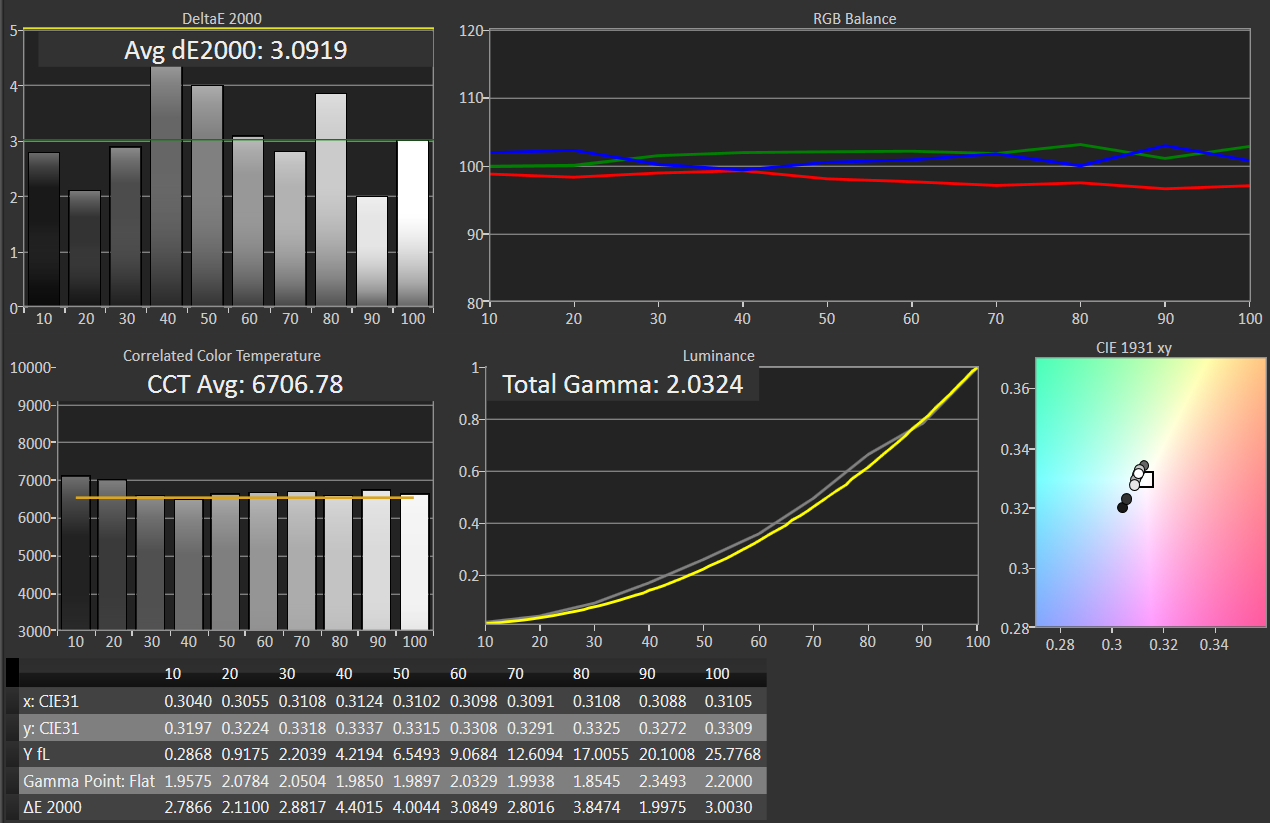


Ray’s display is calibrated with his CS 200/i1 Pro spectros. He simply put his C6 to the screen to take these readings. His set was done previously using the 18% windowbox with no APL. The 18% window graph is the baseline chart here. The readings from the C6 probe are supplemented by the calibration tables that Calman uses. For better or worse, these graphs are simply how the C6 interprets the calibrated results. For more on the Calibration tables themselves and the theory on that stuff, look here.
This data from the Panasonic is looking like how I remembered it. Note the gamma number and how it gets larger and larger as the windowbox gets smaller. There is more of a variance here than on my Samsung plasma. Think of the base readings as starting at a dE of 3.0 or so. There is a variance of up to 0.5 dE in each direction. As Ray noted when he sent me the data, look at the 100% light output reading with the 50% APL pattern … and look at the jump from the standard patterns when it gets to the 5% windowbox. It’s interesting data.
Do not jump to some distorted conclusion that you will get 3 fL more light output if you use a certain pattern so you have to run back and recalibrate the TV. You won’t. That’s not how it works. You are seeing the ABL kick in and out with these graphs and that is all.
Conclusion. It would appear that not all plasma sets behave the same way. In the case of the Samsung here, the idea that using APL patterns would give a better calibrated result cannot be supported. The data just doesn’t show that at all. Will this be different on other sets? Who knows. But it does say that people should not just blindly trust what those monkeys in the room decided. You need to test it out for yourself to see if it really makes a difference and if that difference is actually large enough to matter.
And then we have the data from the Panasonic plasma set. There is more variance here than with the Samsung, but this difference is still far too little for human eyes to be able to see any difference. Beyond human perception still applies here. So you can get an dE of 1.5 one way and 2.0 the other. Big deal … zzzzzzzzzzzzzz …differences on a sheet of paper and nothing else really. People that claim to be able to tell a difference in the image are smoking some special kind of weed.
Just getting a different result is not a guarantee that the result was better … it is simply different. If you pick perfection as your bulls-eye, your APL approach is not hitting the bull-eye either, just another place on the same target that is about the same distance as the standard methodology. I went through APL patterns from 10 to 50% … and exactly which of these is the best one to go with? And that is precisely the issue here.
None of these APL patterns actually represent typical viewing for anyone. And everyone’s viewing habits will be different thus causing the ABL to behave differently as well. Exactly what kind of rational fact based thinking leads one to use an APL pattern that has an 18% background and not one with a 25% background or 50%?
It’s a WAG (Wild Ass Guess) in all cases. And the only rationale here is that it produced a slightly better graph, but is it actually more accurate as a result based on the programming that the person watches. He has no way of knowing. And calibration decisions are based on this kind of thinking? As I said to one person, you can rationalize this all you want, but that does not make it correct or right; but if it makes you feel better as a result … then that is what it is about.
[important]When did calibration become something warm and fuzzy?[/important]